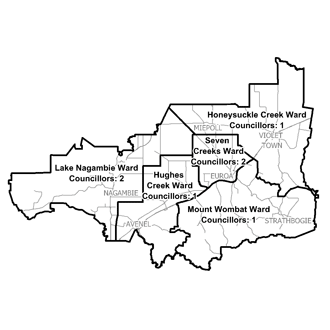
Results for Strathbogie Shire Council Elections 2012
Honeysuckle Creek Ward
(1 vacancy)
| Enrolment: | 1323 |
|---|
| Formal Votes: | 1033 |
|---|
| Informal Votes: | 23 (2.18% of the total votes)
|
|---|
| Voter Turnout: | 1056 (79.82% of the total enrolment)
|
|---|
First preference votes
| Candidate
| First preference votes | Percentage |
|---|
| STORER, Patrick | 831 |  80.45% 80.45%
|
| MAHER, Tom | 202 |  19.55% 19.55%
|
Please note:- all first preference percentages have been rounded to two decimal points.
Hughes Creek Ward
(1 vacancy)
| Elected:
| LITTLE, Malcolm (Unopposed) |
|---|
Lake Nagambie Ward
(2 vacancies)
| Elected:
| PURBRICK, Alister John (1st elected) |
|---|
| Elected:
| SWAN, Debra Elaine (2nd elected) |
|---|
| Enrolment: | 2649 |
|---|
| Formal Votes: | 1981 |
|---|
| Informal Votes: | 31 (1.54% of the total votes)
|
|---|
| Voter Turnout: | 2012 (75.95% of the total enrolment)
|
|---|
| Quota: | 661 |
|---|
-
Distribution Report (XLS 18kB
, XML 18kB)
|
First preference votes
| Candidate
| First preference votes | Percentage |
|---|
| SWAN, Debra Elaine | 577 | 29.13%
|
| DAWN, David | 361 | 18.22%
|
| PURBRICK, Timothy | 172 | 8.68%
|
| PURBRICK, Alister John | 871 | 43.97%
|
Please note:- all first preference percentages have been rounded to two decimal points.
Mount Wombat Ward
(1 vacancy)
| Elected:
| WEATHERALD, Robin Hull |
|---|
| Enrolment: | 1375 |
|---|
| Formal Votes: | 1015 |
|---|
| Informal Votes: | 46 (4.34% of the total votes)
|
|---|
| Voter Turnout: | 1061 (77.16% of the total enrolment)
|
|---|
First preference votes
| Candidate
| First preference votes | Percentage |
|---|
| WEATHERALD, Robin Hull | 531 | 52.32%
|
| MURRAY, Neil | 484 | 47.68%
|
Please note:- all first preference percentages have been rounded to two decimal points.
Seven Creeks Ward
(2 vacancies)
| Elected:
| FURLANETTO, Colleen (1st elected) |
|---|
| Elected:
| WILLIAMS, Graeme Mick (2nd elected) |
|---|
| Enrolment: | 2704 |
|---|
| Formal Votes: | 2182 |
|---|
| Informal Votes: | 43 (1.93% of the total votes)
|
|---|
| Voter Turnout: | 2225 (82.29% of the total enrolment)
|
|---|
| Quota: | 728 |
|---|
-
Distribution Report (XLS 18kB
, XML 18kB)
|
First preference votes
| Candidate
| First preference votes | Percentage |
|---|
| MULLEY, Greg | 399 | 18.29%
|
| FURLANETTO, Colleen | 680 | 31.16%
|
| CARLSON, Gregory | 337 | 15.44%
|
| WOODHOUSE, Peter | 177 | 8.11%
|
| WILLIAMS, Graeme Mick | 589 | 26.99%
|
Please note:- all first preference percentages have been rounded to two decimal points.