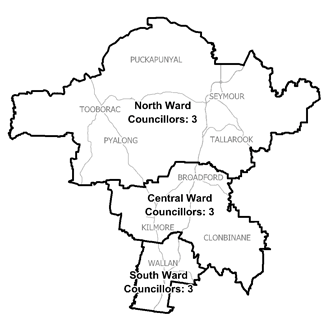
Results for Mitchell Shire Council Elections 2012
Central Ward
(3 vacancies)
| Elected:
| PARKER, Rodney John (1st elected) |
|---|
| Elected:
| STEWART, Kelley (2nd elected) |
|---|
| Elected:
| LEE, Ross (3rd elected) |
|---|
| Enrolment: | 9428 |
|---|
| Formal Votes: | 6965 |
|---|
| Informal Votes: | 213 (2.97% of the total votes)
|
|---|
| Voter Turnout: | 7178 (76.13% of the total enrolment)
|
|---|
| Quota: | 1742 |
|---|
-
Distribution Report (XLS 27kB
, XML 41kB)
|
First preference votes
| Candidate
| First preference votes | Percentage |
|---|
| LEE, Ross | 985 |  14.14% 14.14%
|
| SHEAHAN, Liam Paul | 333 |  4.78% 4.78%
|
| GOBLE, Annie | 805 |  11.56% 11.56%
|
| STEWART, Kelley | 936 |  13.44% 13.44%
|
| PARKER, Rodney John | 2023 |  29.05% 29.05%
|
| HUMM, Robert | 892 |  12.81% 12.81%
|
| CALLAGHAN, Desmond Anthony | 991 |  14.23% 14.23%
|
Please note:- all first preference percentages have been rounded to two decimal points.
North Ward
(3 vacancies)
| Elected:
| SANDERSON, Rhonda (1st elected) |
|---|
| Elected:
| MELBOURNE, Bill (2nd elected) |
|---|
| Elected:
| CHISHOLM, Bill (3rd elected) |
|---|
| Enrolment: | 8598 |
|---|
| Formal Votes: | 5996 |
|---|
| Informal Votes: | 177 (2.87% of the total votes)
|
|---|
| Voter Turnout: | 6173 (71.80% of the total enrolment)
|
|---|
| Quota: | 1500 |
|---|
-
Distribution Report (XLS 30kB
, XML 55kB)
|
First preference votes
| Candidate
| First preference votes | Percentage |
|---|
| MELBOURNE, Bill | 1445 |  24.10% 24.10%
|
| CHISHOLM, Bill | 822 |  13.71% 13.71%
|
| JAMES, Colin | 427 |  7.12% 7.12%
|
| COPPEL, Graeme | 382 |  6.37% 6.37%
|
| SOLOMON, Alice | 237 |  3.95% 3.95%
|
| TULLETT, Carol | 536 |  8.94% 8.94%
|
| SEXTON, James | 506 |  8.44% 8.44%
|
| SANDERSON, Rhonda | 1641 |  27.37% 27.37%
|
Please note:- all first preference percentages have been rounded to two decimal points.
South Ward
(3 vacancies)
| Elected:
| CORNISH, Bob (1st elected) |
|---|
| Elected:
| MULRONEY, Kevin (2nd elected) |
|---|
| Elected:
| MARSTAELLER, Sue (3rd elected) |
|---|
| Enrolment: | 8936 |
|---|
| Formal Votes: | 6069 |
|---|
| Informal Votes: | 195 (3.11% of the total votes)
|
|---|
| Voter Turnout: | 6264 (70.10% of the total enrolment)
|
|---|
| Quota: | 1518 |
|---|
-
Distribution Report (XLS 25kB
, XML 30kB)
|
First preference votes
| Candidate
| First preference votes | Percentage |
|---|
| MULRONEY, Kevin | 1319 |  21.73% 21.73%
|
| JAMES, David | 338 |  5.57% 5.57%
|
| MARSTAELLER, Sue | 1180 |  19.44% 19.44%
|
| CORNISH, Bob | 981 |  16.16% 16.16%
|
| PETTMAN, David | 809 |  13.33% 13.33%
|
| ELDRIDGE, Rob | 670 |  11.04% 11.04%
|
| WYATT, Simon | 772 |  12.72% 12.72%
|
Please note:- all first preference percentages have been rounded to two decimal points.
