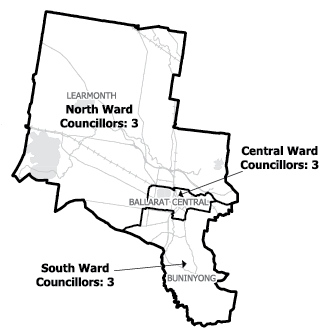
Results for Ballarat City Council Elections 2012
Central Ward
(3 vacancies)
| Elected:
| McINTOSH, Samantha (1st elected) |
|---|
| Elected:
| BURT, John Charles (2nd elected) |
|---|
| Elected:
| COATES, Belinda (3rd elected) |
|---|
| Enrolment: | 22818 |
|---|
| Formal Votes: | 16684 |
|---|
| Informal Votes: | 479 (2.79% of the total votes)
|
|---|
| Voter Turnout: | 17163 (75.22% of the total enrolment)
|
|---|
| Quota: | 4172 |
|---|
-
Distribution Report (XLS 28kB
, XML 45kB)
|
First preference votes
| Candidate
| First preference votes | Percentage |
|---|
| COATES, Belinda | 3197 |  19.16% 19.16%
|
| BURT, John Charles | 3006 |  18.02% 18.02%
|
| FITZGERALD, Gary William | 523 |  3.13% 3.13%
|
| FREEMAN, Matthew | 836 |  5.01% 5.01%
|
| OVERINGTON, Jenny | 1051 |  6.30% 6.30%
|
| McINTOSH, Samantha | 4355 |  26.10% 26.10%
|
| HARRIS, Mark | 2379 |  14.26% 14.26%
|
| CROMPTON, Glen | 1337 |  8.01% 8.01%
|
Please note:- all first preference percentages have been rounded to two decimal points.
North Ward
(3 vacancies)
| Elected:
| COLTMAN, Vicki (1st elected) |
|---|
| Elected:
| PHILIPS, John (2nd elected) |
|---|
| Elected:
| JOHNSON, Amy (3rd elected) |
|---|
| Enrolment: | 24803 |
|---|
| Formal Votes: | 19247 |
|---|
| Informal Votes: | 488 (2.47% of the total votes)
|
|---|
| Voter Turnout: | 19735 (79.57% of the total enrolment)
|
|---|
| Quota: | 4812 |
|---|
-
Distribution Report (XLS 25kB
, XML 33kB)
|
First preference votes
| Candidate
| First preference votes | Percentage |
|---|
| CARTER, Allan John | 1535 |  7.98% 7.98%
|
| HEBBARD, Scott | 1894 |  9.84% 9.84%
|
| MOLONEY, Daniel | 2901 |  15.07% 15.07%
|
| COLTMAN, Vicki | 4963 |  25.79% 25.79%
|
| JOHNSON, Amy | 3908 |  20.30% 20.30%
|
| PHILIPS, John | 4046 |  21.02% 21.02%
|
Please note:- all first preference percentages have been rounded to two decimal points.
South Ward
(3 vacancies)
| Elected:
| HUDSON, Des (1st elected) |
|---|
| Elected:
| MORRIS, Joshua (2nd elected) |
|---|
| Elected:
| INNES, Peter (3rd elected) |
|---|
| Enrolment: | 25104 |
|---|
| Formal Votes: | 18912 |
|---|
| Informal Votes: | 557 (2.86% of the total votes)
|
|---|
| Voter Turnout: | 19469 (77.55% of the total enrolment)
|
|---|
| Quota: | 4729 |
|---|
-
Distribution Report (XLS 28kB
, XML 47kB)
|
First preference votes
| Candidate
| First preference votes | Percentage |
|---|
| RINALDI, Jim | 2930 |  15.49% 15.49%
|
| INNES, Peter | 3075 |  16.26% 16.26%
|
| MATTSON, Matt | 389 |  2.06% 2.06%
|
| MORRIS, Joshua | 3617 |  19.13% 19.13%
|
| PELCHEN, Stephen J. | 1726 |  9.13% 9.13%
|
| ELDRIDGE, David Kenneth | 1292 |  6.83% 6.83%
|
| HUDSON, Des | 5034 |  26.62% 26.62%
|
| SIVAMALAI, Sundram | 849 |  4.49% 4.49%
|
Please note:- all first preference percentages have been rounded to two decimal points.
